 |
explore harmonograms, spirographs, and lissajous figures with the encyclogram! |
 |
| Click here for a larger encyclogram! |
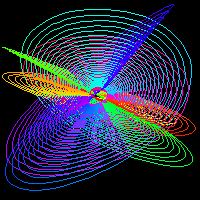 |
To make colorful harmonograms, click the "color" box and make sure that "decay" is checked. Then click the "random" button (or you can drag any sliders and watch as the image changes). | 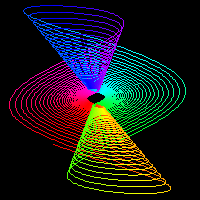 |
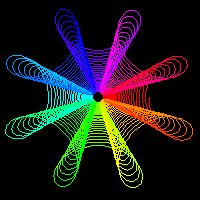 |
To make colorful spirographs, click the "spiro" box and the "color" box. The "decay" box can be checked or unchecked. Then click the "random" button (or you can drag any sliders, but leave the phases alone for true spirographs). | 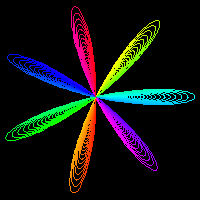 |
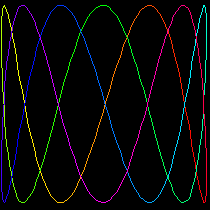 |
To make colorful lissajous figures, click the "color" box, but leave the "spiro" box and the "decay" box unchecked. Then drag any sliders, but set one amplitude on each side to zero. | 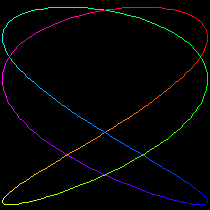 |
| What is the math behind these drawings? At the left of the applet are two sets of x-pendulum controls; at the right of the applet are two sets of y-pendulum controls. x is the horizontal direction in the drawing area, and y is the vertical direction. Each pendulum (2 per axis) has an amplitude, frequency, and phase.
Frequency generally has the greatest effect, controlling the
number of lobes. You can enjoy the encyclogram without knowing any mathematics, but it is interesting to explore the effect of each slider on each type of figure... and the encyclogram also shows what can be done with sine curves, if you're studying trigonometry. |
Visit the Math Cats' animated Lissajous Lab, too!